The Medical Industry and the American Diabetes Association (ADA) have a vested interest in deceiving diabetics about proper blood sugar levels? They use overt and covert means to convince diabetics that elevated blood sugars are ‘acceptable’.
- Truly normal, non-diabetic blood sugars should be the goal of all diabetics.
- The ADA promotes elevated blood sugar levels … for a reason.
The ADA and the Medical Industry want you to believe that elevated blood sugars are ‘ok’. It does this in many ways, one example is the subject of this post, an article posted in an ADA publication.
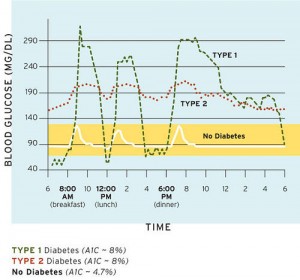
I comment on the chart above in the next section. I want you to see the “No Diabetes” line, with three blips due to meals. Notice also the extremely volatile Type 1 and Type 2 Diabetes lines? The extreme volatility and elevated blood sugars are so harmful. These are examples of the soaring highs and crashing lows of the ‘diabetes roller-coaster’. So sad and so needless.
Ups and Downs of Blood Glucose
One of the ADA’s many websites published an article that was so insightful, it incited anger.
The title of the article is “The Ups and Downs of Blood Glucose”. This was a simple, short post showing how three hypothetical persons’ blood sugar readings might look … if they were hooked up to a Continuous Glucose Monitoring (CGM) device.
Here’s the chart from the post below.
This article including the graph disgusts me… why?
The Good and the Bad
I’ll start out with the good, this chart does one thing very well. It shows very clearly what a non-diabetics blood sugar would look like with little to no insulin resistance, the ‘No Diabetes” line. The three blips are for the high carb meals that spike blood sugars, but then come down into normal ranges.
The rest of the chart and the article are BAD news for diabetics.
At no point does the article claim that the “No Diabetes” line is achievable for diabetics nor does it state that the “No Diabetes” line is preferred.
It deceives by omission.
The chart and the article implies that the diabetes roller coaster of soaring highs and crashing lows is normal and to be expected.
Nothing could be further from the truth!
Of course, if you eat a high carb, grain-based meal plan that is promoted by the ADA and the Medical Industry, your blood sugars WILL look like those for the Type 1 and Type 2 diabetic.
Folks, there is a BETTER WAY! Here is my truly diabetic friendly meal plan.
My Diabetes Chart
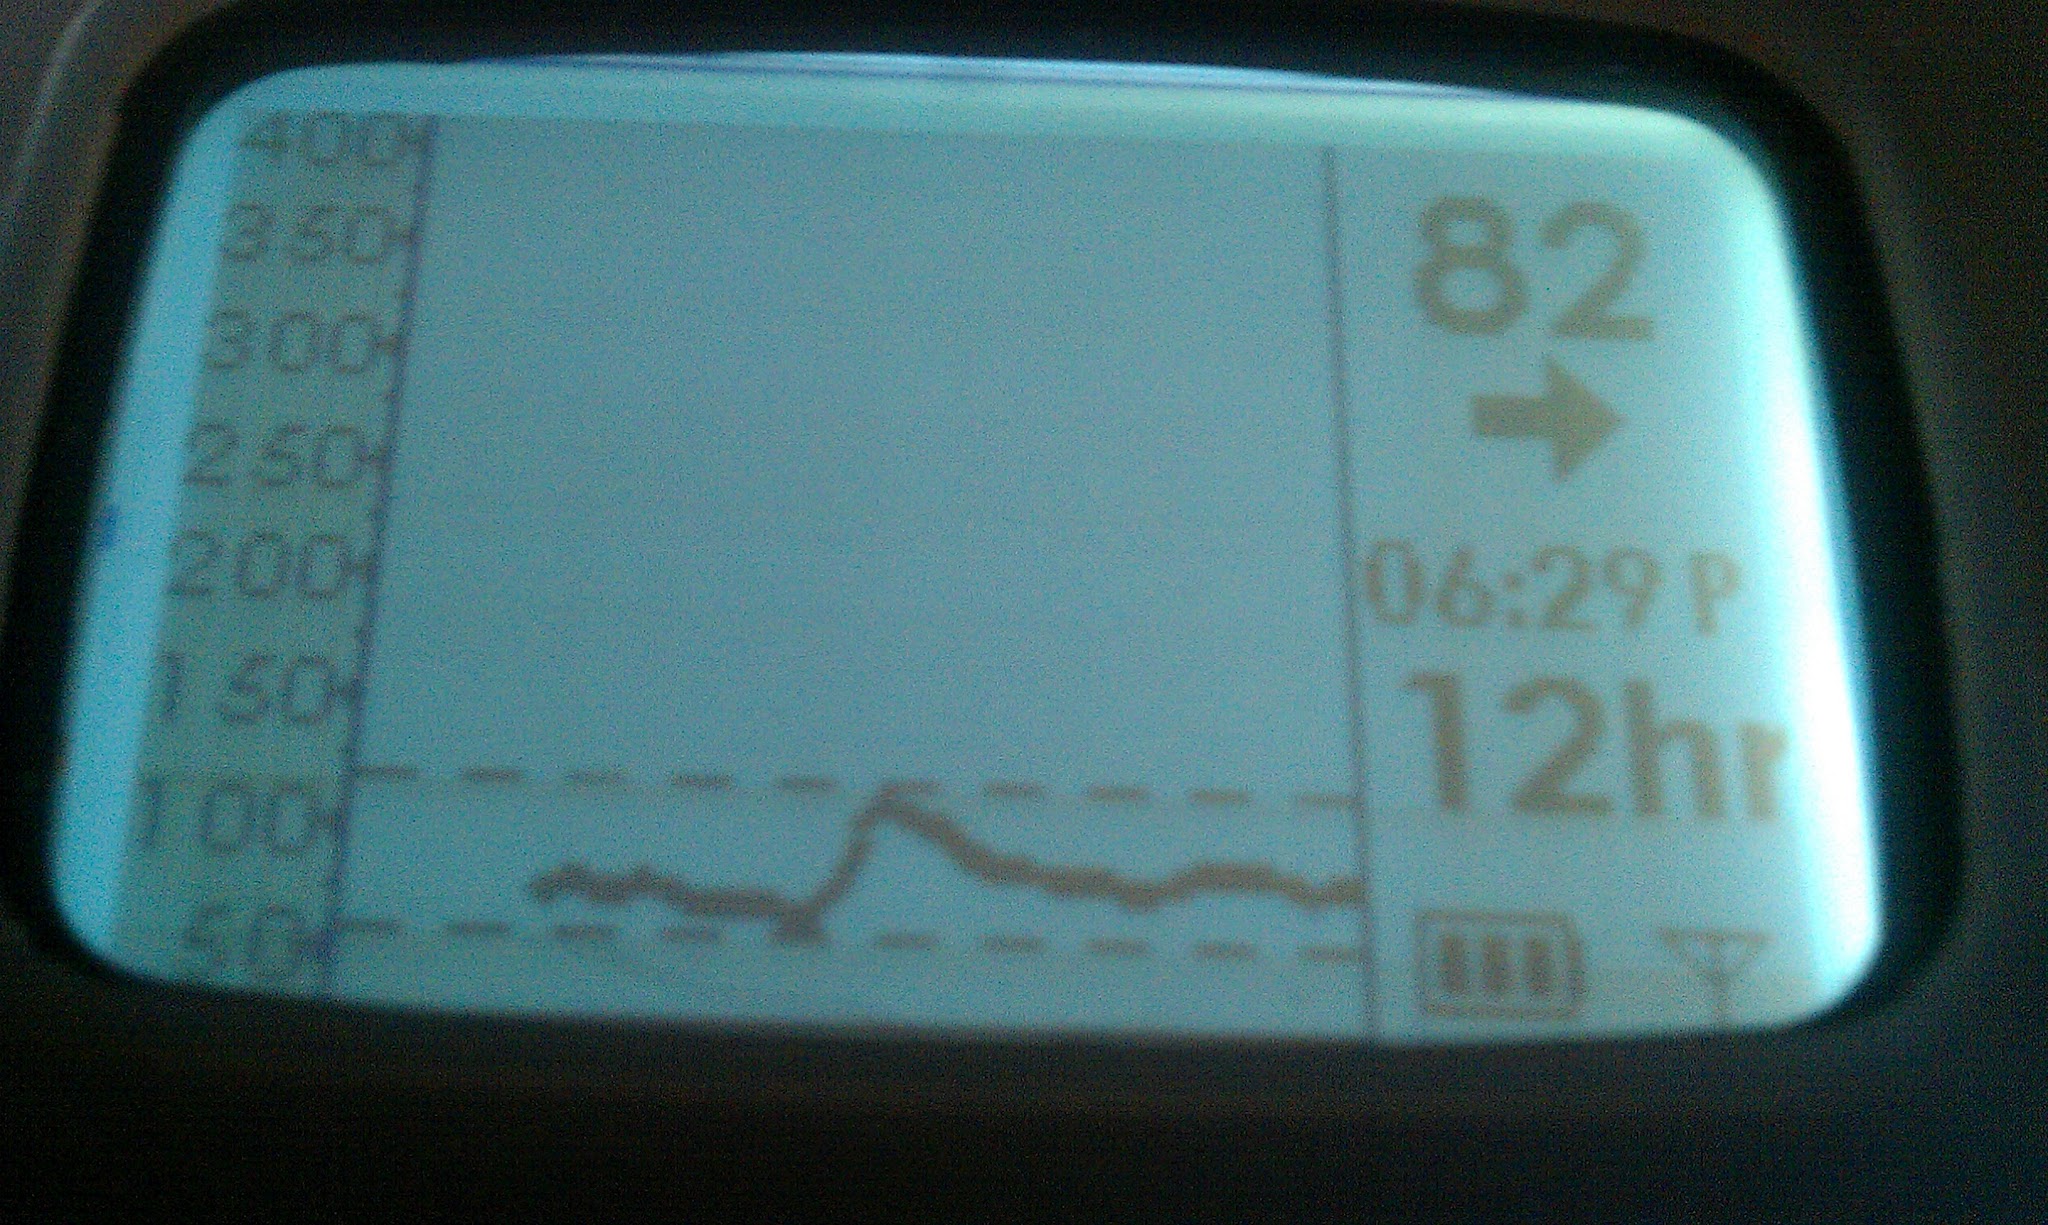
Below is a sample Continuous Glucose Meter screen shot I’ve taken in the past.
Please note:
- Notice I stay well between the lines? The lines are 120 mg/dl on the upper and 50 mg/dl on the lower end.
- The one blip is not due to foods I’ve eaten, but for very intense exercise. Yes, very intense exercise will raise your blood sugars. Read this post, “Diabetes and Exercise“.
- There are no significant increases in blood sugar from the foods I eat.
- My blood sugar readings are EVEN better than the “No Diabetes” line… think about that.
ADA Deception
This chart is just another way to ‘dumb down‘ diabetics into believing that high blood sugar is ‘ok’.
Why in the HELL would you use an example of an A1C of 8 … when ‘teaching diabetics’? And you should make it clear that an A1c of 8 is HORRIBLE and ‘out of control’ blood sugars.
Do you know what an A1C of 8 is indicative of regarding actual blood sugar? It is approximately an AVERAGE of 207 mg/dl !!!! (11.6 mmol/l) EVEN IF A diabetic maintained that day and night that is WAY ABOVE the blood sugar levels that are harmful to cells, organs and LIFE!
AND if you are going to use an A1C of 8, at least have the decency to ANNOUNCE that this is too high and damaging … if you give a damn about diabetics.
Instead they only mention… very nonchalantly,
“… and your target A1C is most likely lower.”
Really? The organization supposedly dedicated to helping diabetics should be promoting truly normal blood sugars.
The ADA knows that diabetics should maintain non-diabetic normal blood sugars, or close to it. If the ADA does not know this? …shame on them. Read this post about my blood sugar goals and why.
Getting Back to the Graph
Here’s what a day of blood glucose readings might look like for someone with no diabetes, a person with type 1(with an A1C of about 8 percent), and a person with type 2 taking oral medication (also with an A1C around 8 percent).
Really, look at the chart closely. These are blood glucose readings of the typical diabetic who follows the ADA’s high carb, grain based meal plan.
Soaring highs and crashing lows. My blood sugars levels are BETTER than readings of the “No Diabetes” line.
That should be the GOAL of all diabetics.
Lower Your Blood Sugar Naturally
If your blood sugars are elevated and you cannot achieve truly normal blood sugars with diet alone…
READ MY BOOK! How to Reduce Blood Sugars.


Comments are closed.